


Weekly Chart Dump
Below the rim players, the trend of box outs, and a look at Wemby's defensive chart

This week’s edition has several quite different topics, one is inspired by the concept I read a while ago in the book by Seth Partnow (The Midrange Theory), the other one is something I’ve noticed while watching several games recently, and the last one came up while I was scanning through my old charts. Let’s get it started.
Below the Rim Players
This is the topic I came across in “The Midrange Theory” book. Seth talked about it in the context of what players might translate poorly when playoff time comes, and “below the rim” players were one of those.
When talking about such players, we will focus on the big men, especially those who spend a lot of time around the rim. These kinds of players don’t have the gravitational pull and spacing factor as outside shooters or playmakers in general, but they can impact the geometry of players lined up on the court in a major way if they’re put in the right situation.
We’re going to look at two different numbers for this chart. The first one is Rim Share, which equates to Total shots in Restricted Area / Total shots. The second number is Dunk Share - Total dunks / Total shots in Restricted Area. I’ll focus on the top 20 players in total rim share and consider only non-transition shots (shots without running prefix) situations.

The “below the rim” players are players with a high share of rim shots but a low dunk share. The one that pops out the most as such a player is Andre Drummond, however, all those folks in the lower part of the chart also display a worrying signal (as all these players take 55%+ of all of their shots inside the RA!).
It’s still tough to gain a complete insight into the level of concern of those numbers because Poeltl, Sabonis, and Wagner are all at 70% or better efficiency around the rim. But Drummond and Jusuf Nurkić are hovering at only 60%, which is way below the league average (66.4% - including transitions). Nurkić can play from the short roll and distribute the ball, but having the opportunity to finish easy rolls near the rim comes in handy come playoff time, which the Suns could always use more of.
On the positive side of this chart, we have the rim runners and dunkers in the upper right corner. None of them are even average shooters but their rim running and vertical presence create a “fake” gravitational field around them. If you combine them with capable ball handlers (Dončić + Gafford/Lively), these players can wreak havoc in the opponent’s defensive schemes. The Mavs seem to have found a way to utilize that to the maximum in their recent games, and I have more trust in their playoff performance than in the Pelicans’ for example.
A Sign of Worry for Zion?
I haven’t mentioned Zion Williamson yet, who has a surprisingly low dunk rate despite his athleticism. Zion is also the player with the highest UAST% percentage of his made shots (yes - even greater than Giannis). That could be an explanation to why is this happening - since he creates a lot of shots for himself (and others) and is often double or triple-teamed on drives to the hoop. Zion is also 2nd in the entire league in the number of times his shot was blocked - 102 in total (Jaren Jackson Jr. is first with 111).
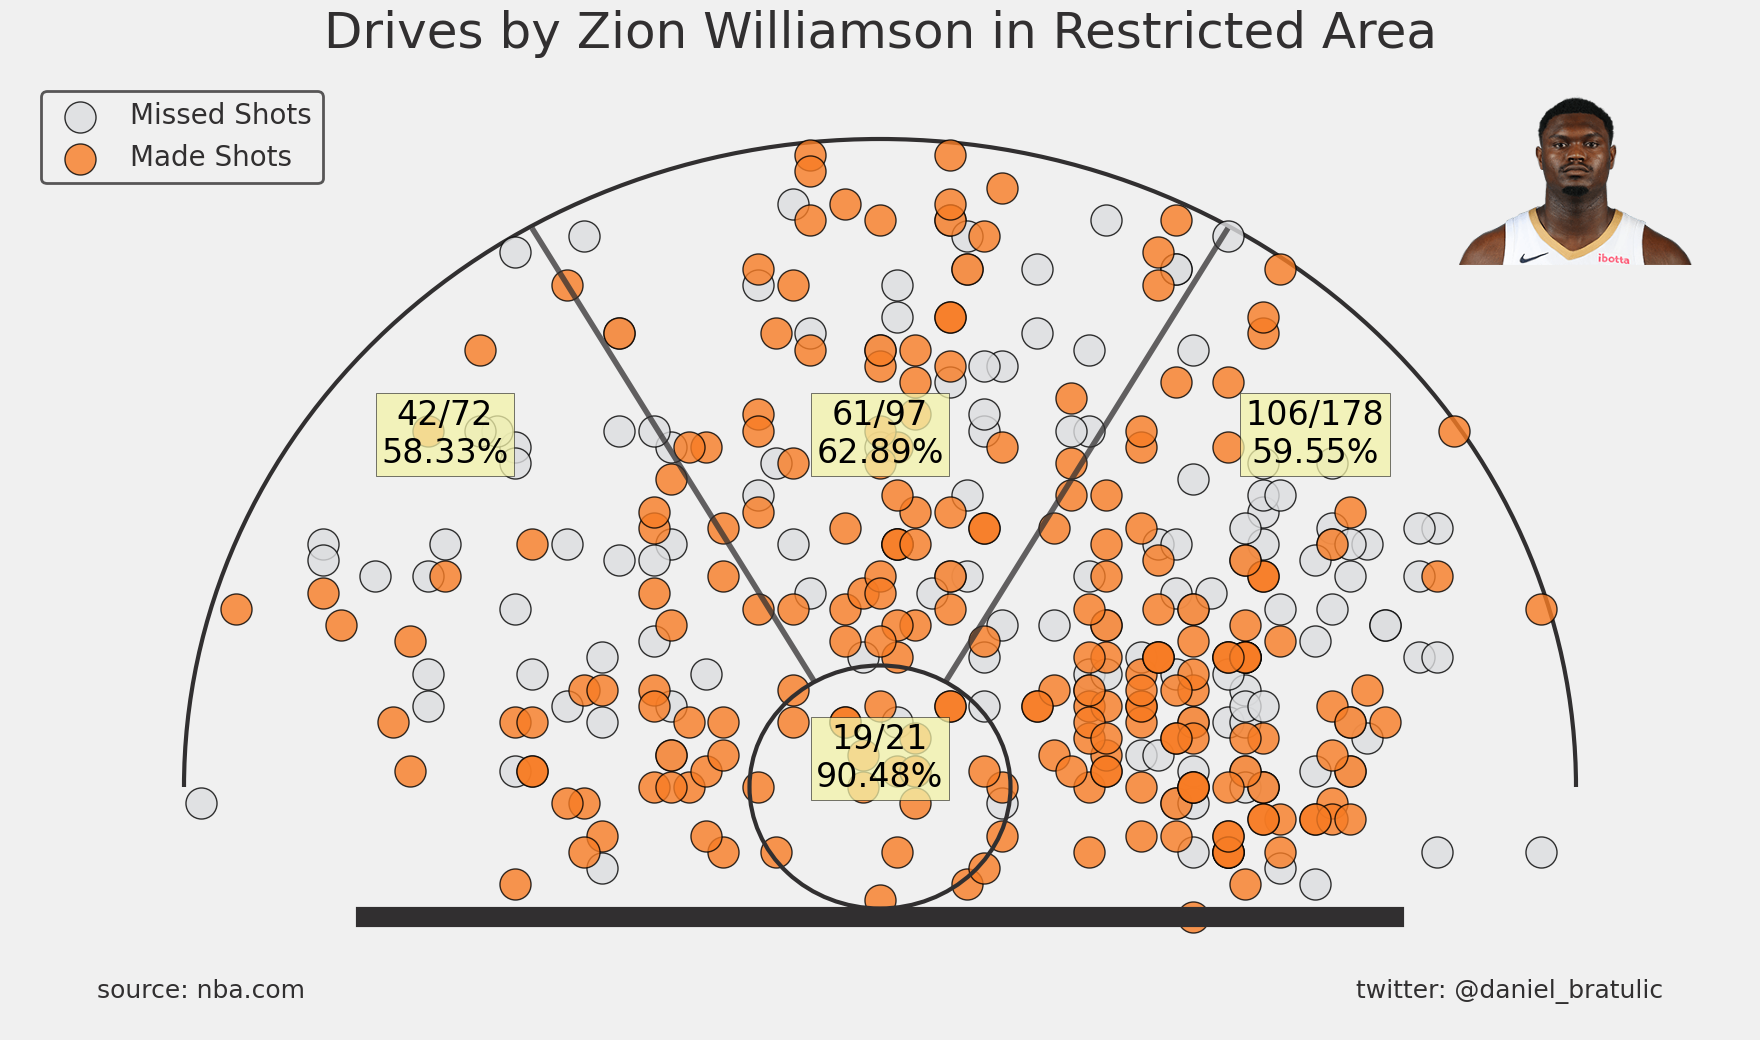
Zion is leaning heavily to his left hand and drives a lot more to the left. That kind of predictability could be an issue for both him and the Pelicans.
Even though these numbers seem quite efficient, Zion is only 29th in RA Drive efficiency (61.95%) among all players with 2 or more driving shots per game inside the RA. I used the data from shot data which differs significantly from the tracking data from the NBA’s website as those take into consideration all drives, even those that end outside of the RA and the tracking data collection is overall more precise (if I were to expand that to all drives using the shot data, his driving efficiency would come a bit closer to tracking data - to 55%).
What Happened to Box Outs?
I don’t know if you’ve noticed, but hardly anyone boxes out nowadays.

The average box outs per game per team has fallen from 29.2 to 6.8 in the current season. That is a ridiculous decrease across the entire league. The question that now arises is - what caused this issue exactly?
We have roughly similar league-wide numbers in pace, field goals per game, 3-pointers per game, and offensive rebounds per game. The “offensive rebound rate”, or ORB/FGA is at roughly 11.5 in the past 8 years or so, that rate stays consistent if we swap FGA for FG3A.
Let’s try to figure out why such a significant fall of box outs happened by turning to the rebounding tracking metrics.
Over here we have a series of box plots that display the number of offensive rebound chances (each box represents distribution among 30 teams) per game - and we can see a significant drop in the median of those numbers - from 30.75 to 24.50.
So can we dumb it down to a simple explanation of “Teams are simply not crashing the board anymore?”.
The numbers seem to point to that, and even though the number of 3-pointers didn’t rise that much in comparison to the 2017-18 season, the difference is in the personnel that’s taking those 3-pointers now. More and more centers are shooting 3-pointers and thus spacing the floor, being further from the rim, and would be risking a lot more if they go for an offensive rebound, so if the team wants to attack the glass more, the entire team’s mentality must be skewed toward crashing the glass. In addition to that, sometimes a rebound from a long-range 3-point shot can land in your lap without even going for the offensive rebound.
Wemby’s Defensive Chart
“Defensive Chart” was my attempt to visualize how effectively a player defends shots in the zones defined in the NBA’s defense dashboard. This was something I did about 5 years ago (sheesh) and I thought it would be a cool idea to check Wemby’s performance in this area.
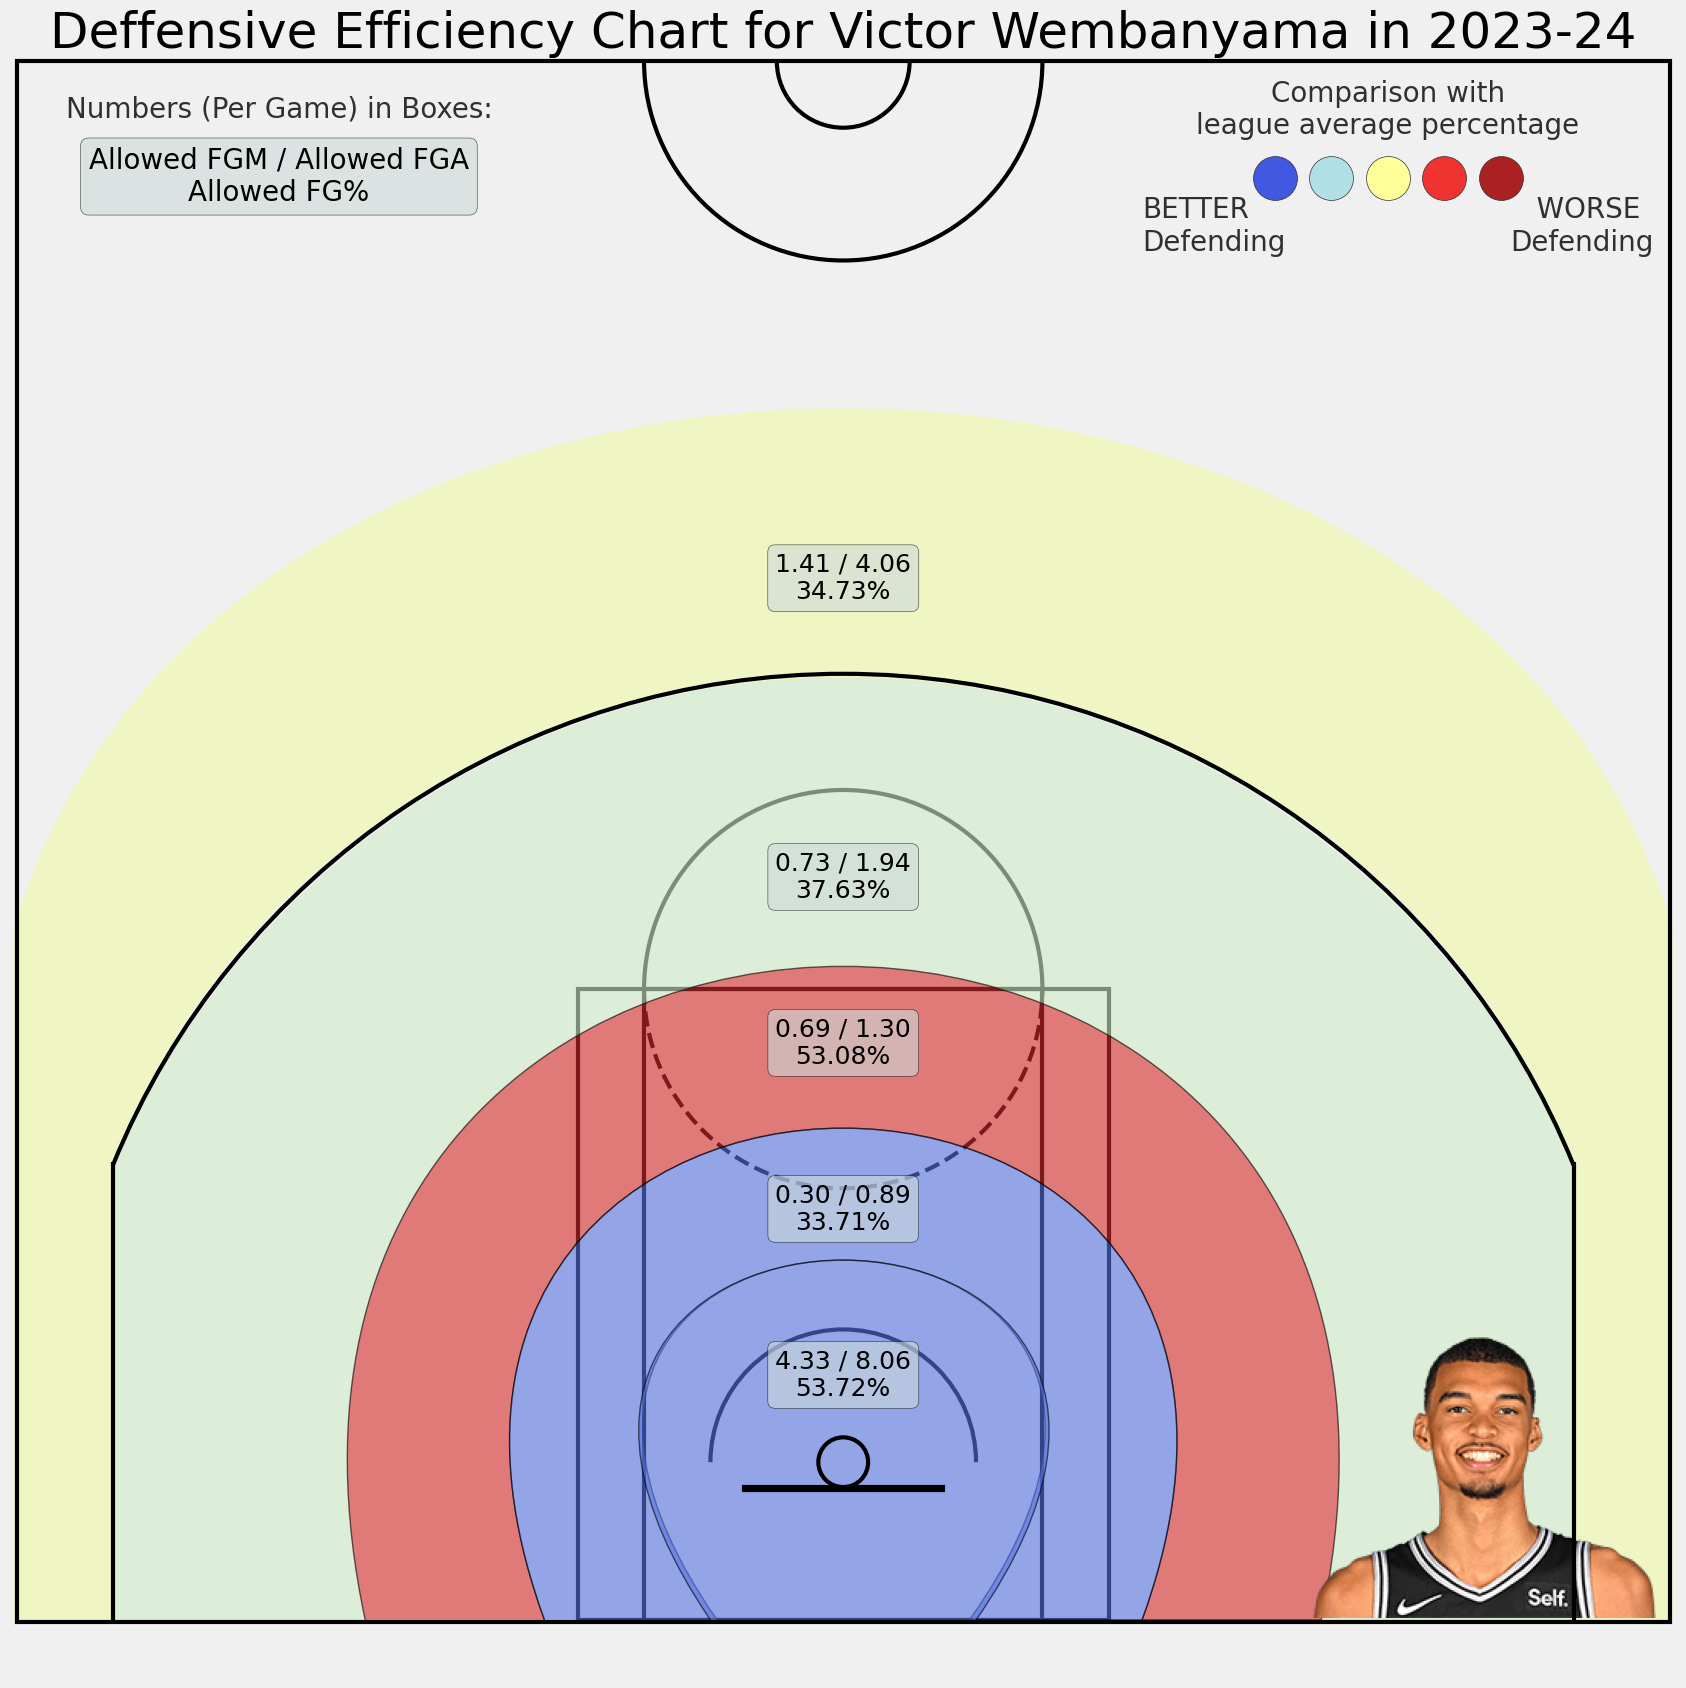
Essentially, it was one of the ways I tried to translate the shot chart onto the defensive side of the ball. This is basically the only option to do something like that, as we don’t have any other defensive locations mapped (for now).
So Wemby’s defensive chart is generally pretty impressive. He doesn’t defend many shots outside of the paint, and his defensive efficiency of 53% in the area closer than 6 ft is extremely good, as there are only a few selected players who are defending the rim area better than him.
That is all for today, I hope you have a nice week!
hi Daniel, I've looked at the boxing out numbers a little in the past and basically came to the conclusion that they must be charting it/cataloguing it differently than in the past. A year ago I tried watching a game and hand-counted way more box-outs than were officially recorded.
Maybe there are arena effects for box-outs, too? Honestly, though, the change is so drastic that it's clearly a league-wide thing. The dip in offensive rebounds occurs mostly before the dip in box-outs, and the magnitude is so much smaller, too. There's something fishy going on, I just can't figure out what.